-01-1.png?width=1200&height=238&name=Logo%20-%20Social%20(V001)-01-1.png)
The best loan officer social media strategies aren't built on guesswork – they're built on data. But data only matters if you know how to read and act on it.
If you're a mortgage coach, team leader, or marketing director managing multiple loan officers, you know the challenge: you can encourage your team to post on social media, but without visibility into what's actually working, you're managing in the dark.
The best coaches don't just hope their team shows up – they know exactly who's performing, what content resonates, and where to focus their energy.
That's why SocialCoach built our analytics dashboard with you in mind.
Our leaderboard system gives you the strategic advantage of seeing the full picture: which loan officers are crushing it, which content drives real engagement, and who needs support before they fall behind.
This guide shows you how to read your team's social media analytics, identify what's working, and turn raw numbers into strategic decisions that move the needle.
📊 Already a SocialCoach Coach? If you don't see these analytics dashboards in your account yet, contact our support team to get access. We'll walk you through the features and help you get started. Contact our Support team →
Not a customer yet? Book a demo to see the leaderboards in action →
Jump to: Understanding Your Analytics | How to Read the Leaderboards | Sort and Filter for Strategic Insights | Identifying Who Needs Help | What to Share with Your Team (or Not) | Internal Team Challenge Ideas | FAQs | Related Resources
Understanding Your Analytics Dashboard: What You're Looking At
When you open SocialCoach's Stats dashboard, you'll see 8 high-level performance cards of your team's activity. Here's what matters:
The Overview Cards: Your Team's Vital Signs
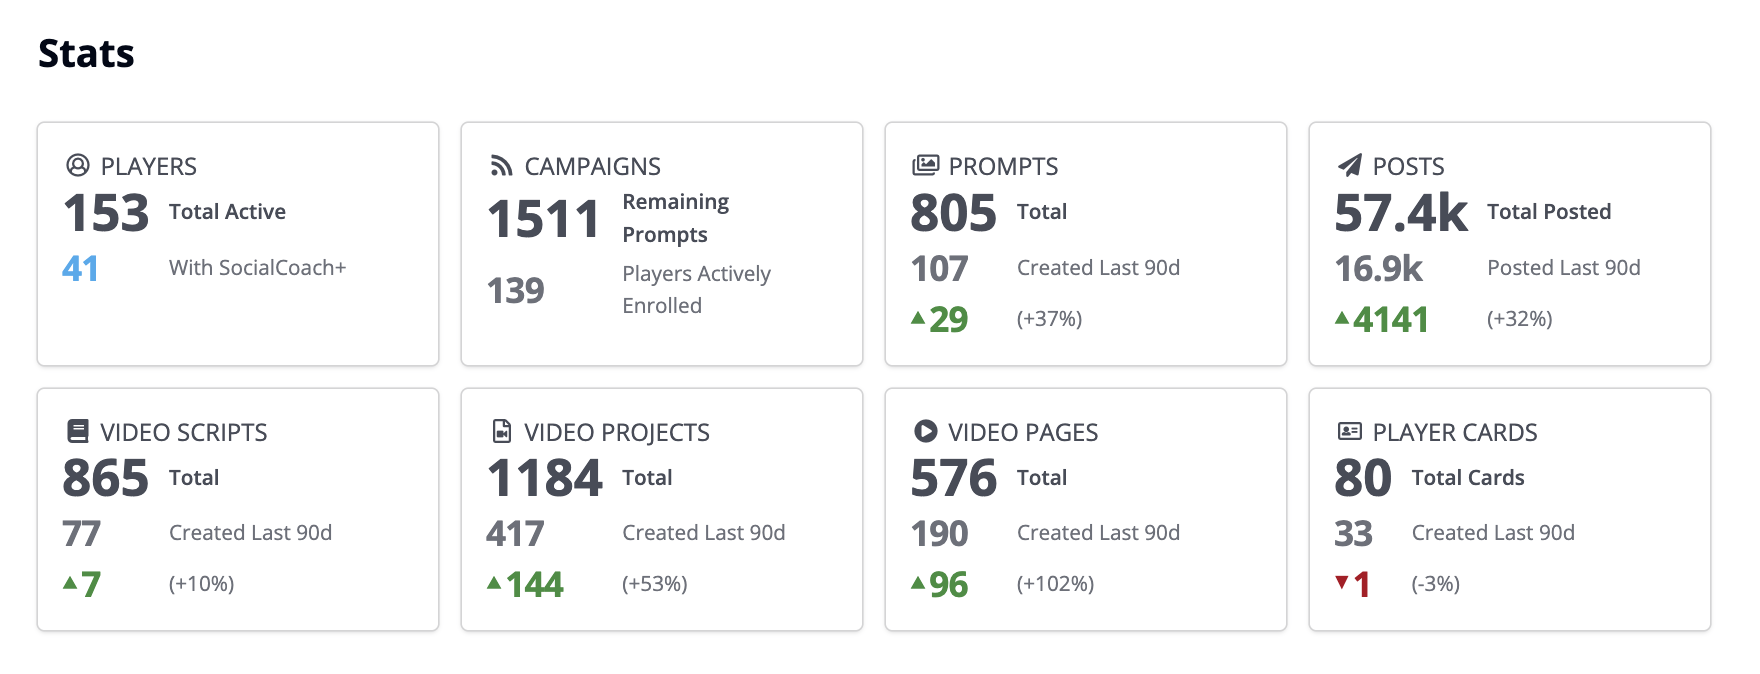
PLAYERS & CAMPAIGNS
- If less than 50% of your team has SocialCoach+ access → tool adoption bottleneck
- If zero players are enrolled in campaigns → promotion or relevance problem
CONTENT CREATION
- If you created 23 prompts but they're not being used → discovery or relevance issue
- If posting growth is negative or flat → team losing momentum
- If you have 806 scripts but only created 8 last quarter → stale content library
VIDEO PERFORMANCE
- If you have 61 completed Video Projects but only 9 Video Pages → your team isn't creating shareable video landing pages to send to prospects
- If you have 47 LOs but only 2 Player Cards → huge missed traffic opportunity
Action Item: Screenshot your Stats dashboard today. This is your baseline for tracking growth.
How to Read the Leaderboards (And What Each One Tells You)
SocialCoach gives you 9 different leaderboards. Each one answers a different strategic question. Here's how to read them and what to do with what you find.
What it shows: Individual post performance ranked by impressions (sortable by shares, clicks, comments, reactions, views)
Strategic questions:
- Are client stories dominating your top 10, or rate updates?
- Is Facebook crushing it while LinkedIn underperforms?
- Is one post significantly outperforming others? What made it different?
What to do:
- Export Top Posts and create a content swipe file
- Share top 5 posts in your next team meeting: "Here's what's working"
- Train your team to model winning formats
Red flags:
- ⚠️ Same person owns all top 10 posts = rest of team needs help
- ⚠️ No clear pattern = content strategy too scattered
- ⚠️ Low engagement across all posts = quality issue
Top Scripts: What Messages Resonate
What it shows: Which video scripts are used most and perform best
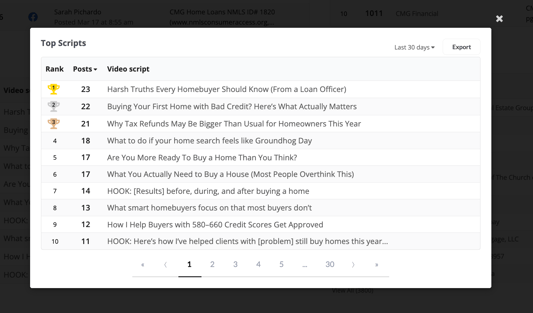
What to do:
- Promote your top 3 scripts to the whole team
- Create variations of top scripts for different niches
- Archive scripts that never get used or perform poorly
Red flags:
- ⚠️ All top scripts are generic = team isn't going deep enough
- ⚠️ Scripts unchanged for 6+ months = not adapting to market
Top Video Pages: Who's Driving Traffic
What it shows: Performance of loan officers' video landing pages
What high traffic means: Prospects are actively researching this LO and watching multiple videos (high intent leads)
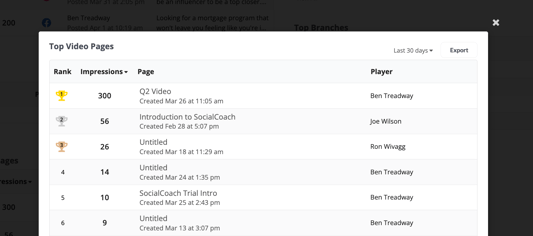
What to do:
- Interview top performers: "How do you promote your Video Page?"
- Share their tactics (Instagram bio, email signature, text messages)
- Help low-traffic LOs optimize promotion
Top Players: Who's Showing Up
What it shows: Individual LO performance across all metrics
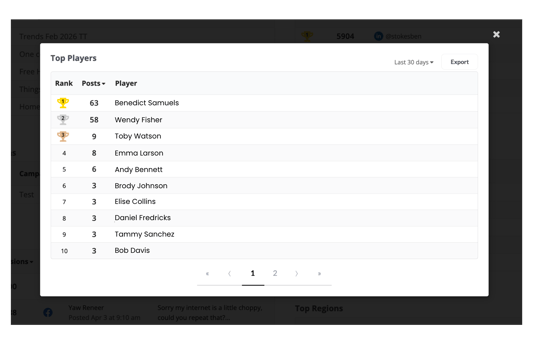
How to segment your team:
-
Top Tier (Top 20%): Celebrate publicly, ask them to mentor, ensure they don't burn out
-
Middle Tier (Middle 60%): Identify barriers, build systems, provide specific feedback
-
Bottom Tier (Bottom 20%): Direct conversations, remove barriers, set minimum expectations
Red flags:
- ⚠️ Same 3 always on top, same 10 never posting = cultural problem
- ⚠️ No middle tier = lack of training/support
Top Branches / Regions: Geographic Performance
Critical insight: If Branch A crushes it and Branch B is silent, that's NOT a market problem – it's a leadership or buy-in problem.
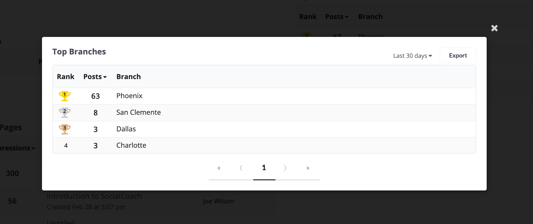
What to do:
- Study top-performing branches: what does their manager do differently?
- Create branch vs. branch challenges
- Intervene in struggling branches with data and support
Top Accounts: Platform Performance
What it shows: Which social platforms drive results
.png?width=765&height=255&name=The%20Huddle%20Section%20Headers%20(1).png)
What to do:
- If one platform gets 5x the engagement, make it your priority
- Test underperforming platforms with optimized content before quitting
- Don't spread too thin—focus on 2-3 platforms max
Top Campaigns: What Initiatives Work
What it shows: Performance of organized campaigns
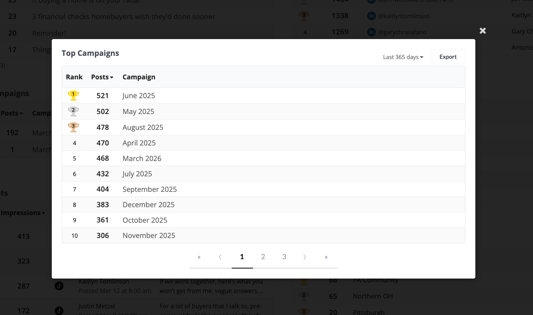
What to do:
- Repeat campaigns with high participation + high performance
- Sunset campaigns with low participation + low results
- Improve rollouts with clear goals, simple execution, 2 weeks notice
Top Prompts: What Topics Resonate
What it shows: Which content prompts your audience engages with
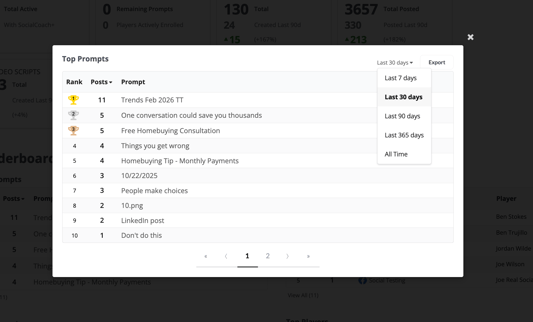
What to do:
- Create more prompts based on top performers
- Retire prompts no one uses
- Fill gaps (missing VA content? Investment property topics?)
📊 Not seeing these leaderboards in your SocialCoach dashboard?
If you're a Coach and don't see these analytics dashboards in your account yet, contact our support team to get access. We'll walk you through the features and help you get started. Contact our Support team →
Not a customer yet? Book a demo to see the leaderboards in action →
How to Sort and Filter for Strategic Insights
Every leaderboard can be sorted by multiple metrics and timeframes. Here's how to use those filters strategically:
Sort by Metric (Impressions, Shares, Clicks, Comments, Reactions, Views)
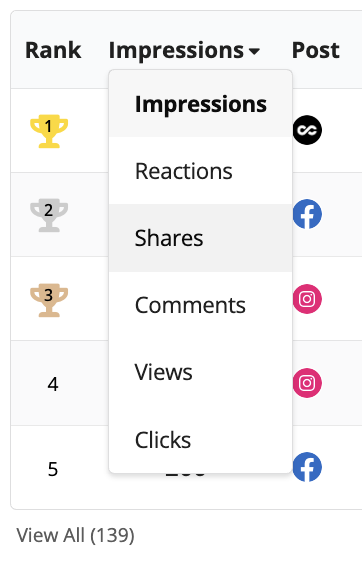
Impressions = Reach
- Who's getting in front of the most eyeballs?
- Good for: awareness, brand building
Reactions = Emotional Resonance
- What content makes people feel something?
- Good for: understanding what topics trigger response
Shares = Virality
- What content is so good people pass it along?
- Good for: expanding reach beyond your followers
Comments = Engagement Depth
- What content starts conversations?
- Good for: building relationships, gauging interest
Clicks = Intent
- What content drives traffic to your website/application?
- Good for: measuring conversion potential
Views = Video Consumption
- Are people actually watching your videos?
- Good for: measuring video content effectiveness
The 6 Metrics: What Each One Measures
| Metric | What It Measures | Strategic Insight |
|---|---|---|
| Impressions | How many people saw it | High impressions + low clicks = awareness content (good for brand, not conversion) |
| Shares | How many passed it along | Most shareable = most valuable to your audience |
| Clicks | Link clicks to website/app | High clicks = high intent, warm leads |
| Comments | People who responded | Posts with questions get 4x more comments |
| Reactions | Likes, hearts, wows | Behind-the-scenes content gets 2x more reactions |
| Views | Video play count | Videos under 45 seconds get 3x more views |
Strategic Use:
Sort by Impressions to see what's getting reach. Then sort the same leaderboard by Clicks to see what's driving action.
If a post has huge impressions but zero clicks, it's entertaining but not converting. If a post has low impressions but high clicks, it's highly targeted content that converts a niche audience.
What to do:
- High impressions + high clicks = do more of this
- High impressions + low clicks = good for brand building, but not necessarily for lead gen
- Low impressions + high clicks = consider boosting its reach
- Low everything = pivot the approach
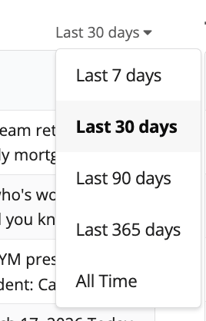
Filter by Timeframe (Last 7/30/90/365 Days, All Time)
The 5 Timeframes: When to Use Each
| Timeframe | Use For | What to Look For |
|---|---|---|
| Last 7 Days | Weekly check-ins | Who's active right now? What's trending? |
| Last 30 Days | Monthly reviews | Who's consistent? What themes dominated? |
| Last 90 Days | Quarterly planning | Who sustained success? Seasonal patterns? |
| Last 365 Days | Annual reviews | Who built real momentum over a year? |
| All Time | Legacy leaders | Who are your all-time MVPs? |
Strategic Use: Compare timeframes to identify trends:
- Rising Stars: Not in Top 10 all-time, but #1 in Last 30 Days = someone just figured it out
- Falling Off: Top 5 all-time, but not even Top 20 in Last 30 Days = burnout or life change
- Steady Performers: Consistently in Top 10 across all timeframes = your reliable MVPs
What to Do:
- Celebrate rising stars publicly – momentum is contagious
- Check in privately with falling-off performers – they might need support
- Study steady performers – what makes them consistent?
📊 Not seeing these leaderboards in your SocialCoach dashboard?
If you're a Coach and don't see these analytics dashboards in your account yet, contact our support team to get access. We'll walk you through the features and help you get started. Contact our Support team →
Not a customer yet? Book a demo to see the leaderboards in action →
Identifying Who Needs Help (And How to Help Them)
Data doesn't just show you who's winning – it shows you who's struggling and why.
Here are the 4 most common types:
Type 1: Posting But Not Performing
Symptoms: High volume, low results
Diagnosis: Content quality issue
Solution: Review their last 10 posts side-by-side with top performer; give specific feedback ("Your videos are great, but add better captions"); pair with mentor
Type 2: The Inconsistent LO
Symptoms: Great posts when they post, but only 1-2x/month
Diagnosis: Time management or perfectionism
Solution: Build batch recording system; lower the bar ("done is better than perfect"); weekly accountability check-ins
Type 3: The Ghost
Symptoms: No posts in 60+ days
Diagnosis: Belief issue, overwhelm, or personal crisis
Solution: Direct conversation: "What's stopping you?"; remove barriers; set minimum expectations (2 posts/month)
Type 4: Wrong Platform LO
Symptoms: Consistent posting but all on underperforming platform
Diagnosis: Platform misalignment
Solution: Show them the data; test other platforms for 2 weeks; platform-specific training
Want detailed diagnostic flowcharts, conversation scripts, and intervention strategies for each type? Download the full playbook → Download Now
What to Share With Your Team (And What to Keep Private)
Here's the critical part: Your loan officers can't see these leaderboards unless you share the data with them.
That's by design. It gives you control over how and when to use performance data.
What to Share Publicly (Team Meetings, Slack, Email)
✅ Top Performers
- "Congrats to Sarah – #1 in impressions last month!"
- "Top 3 posts this week came from Marcus, James, and Lisa. Here's what they posted..."
✅ Team Aggregate Stats
- "We posted 147 times as a team last month – up 23% from last month!"
- "Our content reached 45,000 people in Q1. Keep going!"
✅ Best Practices from Top Posts
- "The #1 post this month was about down payment assistance. Here's why it worked..."
- "Client story posts are outperforming rate updates 3:1. Let's do more of those."
✅ Challenges and Competitions
- "This month's contest: Most total engagement. Current leader is..."
- Share live standings if you're running a team challenge
What to Keep Private (1-on-1 Coaching Conversations)
❌ Bottom Performers
- Never publicly shame someone for not posting or low performance
- Address it privately with curiosity, not judgment
❌ Sensitive Comparisons
- "You're ranked #47 out of 50" = demotivating
- Better: "Let's look at what the top performers are doing and how you can apply it"
❌ Detailed Performance Critiques
- "Your posts are terrible" = not helpful
- Better: "Let's review your last few posts together and identify what could make them stronger"
The Gray Area: Strategic Selective Sharing
Sometimes sharing a leaderboard snippet can motivate without demoralizing:
Example: "Here are our Top 5 Posts from last month. Notice any patterns? Client stories, myth-busting, and quick tips all performed great. If you're wondering what to post, start with these themes."
That way, you're sharing learnings from top performers without exposing anyone as #47.
Another Example: "Quick win to celebrate: Our team's total impressions are up 34% this quarter. The top 10 performers are averaging 3 posts per week. If you're posting less than that, that's your quickest opportunity for growth."
You're giving a benchmark (3 posts/week) without calling anyone out.
Turning Data Into Action: Your Monthly Review Process
Here's a simple monthly routine to turn your leaderboards into strategic decisions:
Week 1: Data Review (60 minutes)
Export Last 30 Days:
- Top Posts
- Top Players
- Top Scripts
- Top Accounts
Answer These Questions:
- What content themes dominated our Top Posts?
- Who are our Top 5 performers and what do they have in common?
- Which platform is winning and which is struggling?
- Who hasn't posted at all?
Identify 3 Strategic Moves: Based on your answers, choose 3 actions for this month:
- Example: "Double down on client story content"
- Example: "Train the team on Facebook video best practices"
- Example: "Reach out to 5 inactive LOs and offer help"
Week 2: Share Insights (30 minutes)
Team Meeting or Email:
- Share what's working without exposing who's not
- "Last month, our top content was client stories. Here are 3 examples..."
- "We're seeing great results on Facebook. If you're not posting there, start."
- Create shared folder with screenshots of top posts
Week 3: Individual Coaching (varies)
Reach Out to Struggling LOs:
- Schedule 15-min calls with anyone who hasn't posted or has low performance
- Use diagnostic guide: "What's stopping you from posting?"
- Offer specific help: scripts, batch recording session, buddy system
Celebrate Top Performers:
- Send personal note: "You crushed it last month—keep going!"
- Public shoutout in team meeting
- Ask if they'd share their approach with the team
Week 4: Plan Next Month (30 minutes)
Adjust Strategy Based on Data:
- If Facebook is crushing, shift more resources there
- If client stories dominate, create more client story prompts
- If certain scripts flopped, retire or rewrite them
Set Team Goal:
- "We posted 147 times last month. Let's hit 175 this month."
- "Our top post got 580 impressions. Can anyone beat that?"
📊 Not seeing these leaderboards in your SocialCoach dashboard?
If you're a Coach and don't see these analytics dashboards in your account yet, contact our support team to get access. We'll walk you through the features and help you get started. Contact our Support team →
Not a customer yet? Book a demo to see the leaderboards in action →
Three Ready-to-Launch Team Challenges
Use these proven challenge templates to create healthy competition:
Challenge #1: The Consistency Sprint
Duration: 4 weeks
Goal: Post 3x/week for 4 consecutive weeks
Prize: 1st place $500 | 2nd-3rd $250 | Participation prize: company swag
Track Via: Top Players (Last 30 Days)
Expected Result: 40-60% increase in team posts
Challenge #2: The Engagement Champion
Duration: 30 days
Goal: Highest total engagement (1 pt per reaction, 3 pts per comment, 5 pts per share)
Prize: Winner $750 + featured in marketing | Runner-up $250
Track Via: Export Top Posts, calculate scores
Expected Result: Higher quality content, more client stories
Challenge #3: Branch Wars
Duration: 60 days
Goal: Winning branch = highest total impressions across all team members
Prize: Team lunch ($50/person) + traveling trophy or reward
Track Via: Top Branches (Last 60 Days)
Expected Result: Branch-level accountability, managers become social media champions
The Bottom Line: Data Without Action Is Just Numbers
You now have access to more loan officer social media performance data than most mortgage teams will ever see.
But here's the truth: having the data doesn't matter if you don't use it.
The best coaches don't just look at leaderboards – they:
- ✅ Identify what's working and do more of it
- ✅ Spot who's struggling and help them improve
- ✅ Turn insights into action with clear next steps
- ✅ Celebrate wins and create momentum
- ✅ Course-correct when something isn't working
Your leaderboards are only as valuable as the decisions you make with them.
Coach Challenge: This week, commit to one thing
- Pull your Top Posts leaderboard and share the top 3 with your team
- Reach out to one struggling LO and offer help
- Export your Top Players data and celebrate your #1 performer
- Review your Top Scripts and create more content around what's working
Start small. Build the habit of using your data. And watch your team's loan officer social media results transform from guesswork to growth.
📊 Not seeing these leaderboards in your SocialCoach dashboard?
If you're a Coach and don't see these analytics dashboards in your account yet, contact our support team to get access. We'll walk you through the features and help you get started. Contact our Support team →
Not a customer yet? Book a demo to see the leaderboards in action →
FAQs
How often should I check the leaderboards?
Weekly for quick pulse checks. Look at Last 7 Days to see who's active and what's trending.
Monthly for strategic decisions. Deep dive into Last 30 Days data to identify patterns, celebrate wins, and adjust strategy.
Quarterly for big-picture trends. Review Last 90 Days to see sustained performance and plan next quarter's initiatives.
Should I show my team the leaderboards?
It depends on your team culture.
Share selectively if:
- Your team is competitive and motivated by rankings
- You're running an official challenge or contest
- You can frame it positively (celebrate top performers without shaming bottom ones)
Keep it private if:
- Your team is sensitive to comparison
- You have large performance gaps that could be demoralizing
- You want to use the data for coaching without creating pressure
Best practice: Share insights and examples from the leaderboards without exposing full rankings. "Here are our top 5 posts this month and why they worked" is more useful than "Here's who's ranked #1-50."
What if the same people always dominate the leaderboards?
This is common and reveals two things:
- You have rockstars. Celebrate them, learn from them, have them mentor others.
- You have a support gap. The rest of your team needs training, tools, or motivation to compete.
Solutions:
- Create multiple leaderboards for different metrics (one person might dominate impressions, but someone else leads in engagement)
- Run "most improved" challenges so progress is rewarded, not just top performance
- Pair top performers with struggling LOs for mentorship
- Set minimum participation standards so everyone's contributing
What metrics matter most?
It depends on your goals.
- For brand awareness → Impressions and Reach
- For engagement → Comments, Shares, Reactions
- For lead generation → Clicks and DMs
- For content consumption → Views and Video Page traffic
Best practice: Choose one primary KPI per month. "This month: increase total impressions by 25%." Next month, shift focus.
How do I know if someone needs help or just doesn't care?
Have a conversation. Low performance could mean:
- They don't know what to post (skill issue → training)
- They don't have time (systems issue → batch recording, scheduling tools)
- They're embarrassed to be on camera (confidence issue → practice, coaching)
- They don't believe social media works (mindset issue → show them data, peer success)
- They genuinely don't care (motivation issue → set expectations, consequences)
You can't diagnose this from data alone. Use the data to start the conversation, then listen.
What's a realistic posting goal for my team?
Start with your baseline. If your team currently averages 1 post per person per month, don't demand 12. Aim for 3.
Industry benchmarks:
- Minimum viable: 2 posts per week (8-10/month)
- Consistent presence: 3 posts per week (12-15/month)
- High performance: 4-5 posts per week (16-20/month)
But context matters:
- Team size (5 LOs vs. 500 LOs)
- Support level (do they have marketing help or doing it solo?)
- Market conditions (hot market = more activity, slow market = harder to get traction)
Best practice: Look at your Top Players' posting frequency. That's your realistic high-performance benchmark. Set team goals somewhere between your current average and your top performers' average.
Can I export this data for reporting?
Yes. Each leaderboard has an Export function.
Use this to:
- Create monthly performance reports for leadership
- Track trends over time in a spreadsheet
- Share curated insights with your team
- Build case studies of top performers
Pro tip: Export the same leaderboard (e.g., Top Posts, Last 30 Days) on the same day each month. Track how the top 10 changes over time. This shows you trends you'd miss looking at snapshots.
How do I use this data without making my team feel micromanaged?
Frame it as support, not surveillance.
Don't say: "I'm tracking everything you post."
Do say: "I want to see what's working so I can help everyone succeed."
Don't say: "You're ranked #43 out of 50."
Do say: "Let's look at what the top performers are doing and how you can apply it."
Don't say: "You need to post more."
Do say: "What's stopping you from posting consistently? How can I help?"
The data is a tool for coaching and support, not punishment. Use it to remove barriers, celebrate wins, and guide strategy – not to shame people into compliance.
Have more questions? Get answers about the SocialCoach platform by scheduling a walkthrough now.
Ready to Turn Your Team's Social Media Data Into Real Results?
SocialCoach's analytics and leaderboard system gives mortgage leaders the visibility and insights they need to turn social media from a struggle into a competitive advantage.
What you get:
- 9 comprehensive leaderboards (Posts, Players, Scripts, Branches, Regions, Video Pages, Accounts, Campaigns, Prompts)
- Sort by 6 engagement metrics (Impressions, Shares, Clicks, Comments, Reactions, Views)
- Filter by 5 timeframes (Last 7/30/90/365 Days, All Time)
- Export data for reporting and trend analysis
- Real-time performance tracking across your entire team
📞 Book a 15-Minute Demo
See how top mortgage teams are using SocialCoach analytics to identify what works, support who's struggling, and scale their social media impact without manual tracking.
Related Resources:
- The Ultimate Loan Officer Marketing Guide for 2026
- 45 Mortgage Social Media Post Ideas for Loan Officers
- How to Use AI in Marketing Without Losing Authenticity
- Video Catalyst: Done-for-You Scripts & Editing
- Social Media Compliance Tools for Mortgage Teams
Share this guide with a loan officer who needs a smarter strategy in 2026, and make sure to follow SocialCoach for weekly strategies and real-time tactics top loan officers are using to dominate their markets.